The tick counters represent the current and elapsed simulation frames on the server and client. To maintain sync, the client's tick is set to the server's tick upon connect, and the internal clock drift manager class within the engine drifts the client's tick towards the server's tick to manage time deviation (if the system's clock of the server is a bit faster/slower than the client's).
Deviation in tick rate could also happen when the server happens to have a higher update rate than the client (more simulation frames per second), which the operator could adjust using a few console variables.
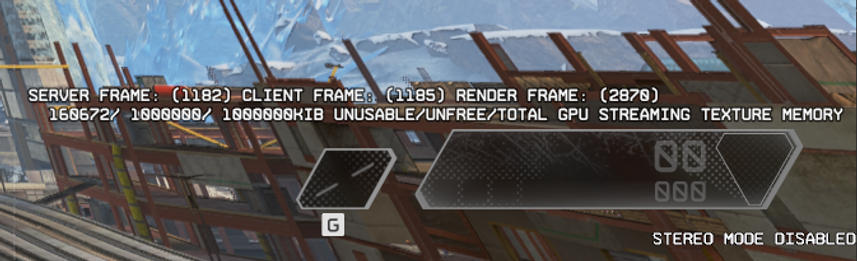
To debug this, I reverse engineered some of the internal CClockDriftMgr class, obtained pointers to 2 singletons and created a simple text overlay which could be enabled to display the current server and client frames, I also added a render frame counter as I stumbled upon the render tick global!
INTRODUCTION
The code above is the result of raw decompiled output from IDA's (Interactive Disassembler) "HexRays" decompiler, which takes assembly code, and "decompiles" it into C like code. There are 2 problems however:
-
The code looks like runes...
-
The code might not be good, user needs to compare with source assembly while rebuilding!
PROGRAMMING
A cool thing about this is that its almost like assembly, its just converted to compilable C... For example, when compiling the line 'pClientState->m_ClockDriftMgr', it will look something like [rcx+180] in the assembler, were 'rcx' is the CClientState pointer and '180' is the offset to the 'm_ClockDriftMgr' member. The decompiler converts the registers to local variables, and handles offsets to members in a similar fashion, which results in code like v8 = *(a1 + 180), were v8 is a CClockDriftMgr* and *(a1 + 180) being pClientState->m_ClockDriftMgr.
Another cool thing is that DLL imports are a good source for symbols. If assembler in question uses a WinAPI function, we can easily determine the type that is passed to this WinAPI function. For example, the code above uses the WinAPI "EnterCriticalSection", which locks the mutex, and releases it with "LeaveCriticalSection", so we know that the global "stru_16073AD28" is a mutex from type "LPCRITICAL_SECTION".
After some thorough static and dynamic analysis, our reverse engineered function looks like this:
Dynamic analysis is a process where we analyze the program at runtime. I set several breakpoints in specific memory addresses (addresses of structure members for example) and follow each 'hit' that is caused by either a read or write. Once we hit a breakpoint, we can see what the function that is reading this member is doing with the value, or in case of a write - what value is written to the member, and how its computed! This is how I determine the name and type of each reverse engineered structure member. The types also define its size and the offset to the next member, this process must be done carefully to yield correct results.
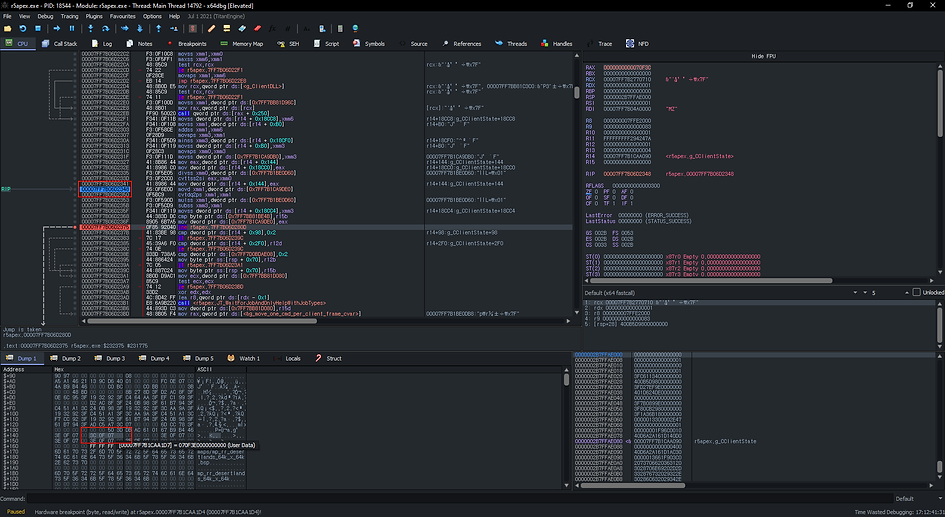
In the image above (click to enlarge), I set an hardware breakpoint at the address highlighted in the lower red box. The program is paused with the Instruction Pointer (RIP) pointing at the very instruction that accessed the address I set a breakpoint at, highlighted in the upper red box. This allows us to easily trace any read/write operations on a specific member of a struct that is dynamically allocated on the heap.
In this particular case, the member I set a breakpoint at was a tick counter in the CClockDriftMgr structure. This was determined as it was set to the value of the tick that was inside the packet send by the server.
Conclusion: members of structures are in most cases reverse engineered in a dynamic fashion, which means we have to execute the program and watch its live memory. The same things apply to virtual functions, due to its late binding behavior, which creates a virtual function table pointer within the structure, pointing to a constant function table which implements the base class.
If the executable of the program contains RTTI (RunTime Type Information), the virtual function tables can be found within the executable using the name of the class them self, which makes reversing them even easier!
The above structure is the result of the reserve engineering. In here we have several useful fields mapped out. There are also a few I don't have mapped out, which are named as 'field_<offset>', where offset is hexadecimal.
With the structure in the SDK, I added the missing member in the CClientState class. I also added 2 const methods to the CClientState class which gets the server and client tick count.
We can now start drawing the tick numbers on the overlay. I created a few console variables here which allow the user to relocate the text on the screen. The offset convars will offset it from x-y. The inversion convars will invert the offset making it start at the other side of the window. This is useful when we want to draw it from the bottom left, so we don't need to offset it from the upper right corner. This is also useful when the window is resized, as the inversion will take care of relocating it, where offsetting it from the upper right to the bottom left would require adjusting the offsets again.
While reversing the clockdrift manager, I also found a few globals in the engine which holds the unusable, unfree and total texture streaming memory. This system was planned to be reverse engineered, so I decided to create an overlay for this while as well.
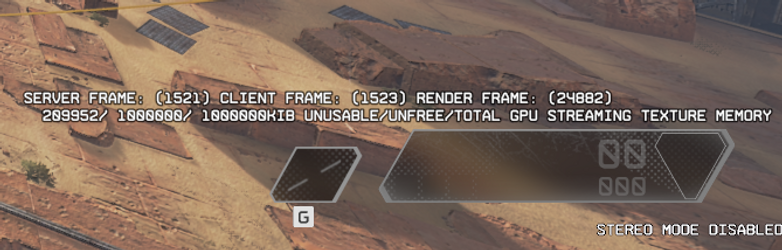
We can now enable, adjust and start monitoring the server and client tick counters (any large deviation means there is a potential timing difference, and if the clock drift manager is enabled, there might be a failure due to a change that was made in the SDK somewhere). We also draw the unusable, unfree and total GPU streaming texture memory, which is useful to monitor, debug and/or reverse engineer the texture streaming system!